
This article is not an introduction to neither Xdebug, Local by Flywheel nor PhpStorm, but shows you how you can get started with debugging and profiling your WordPress sites in PhpStorm when using Local by Flywheel as a local development environment. You should already know what Xdebug is before reading this article. This is how you get started with Xdebug in Local by Flywheel.
Enabling Xdebug in Local by Flywheel requires you to have a “custom” environment, so make sure you select this when you setup a new site.
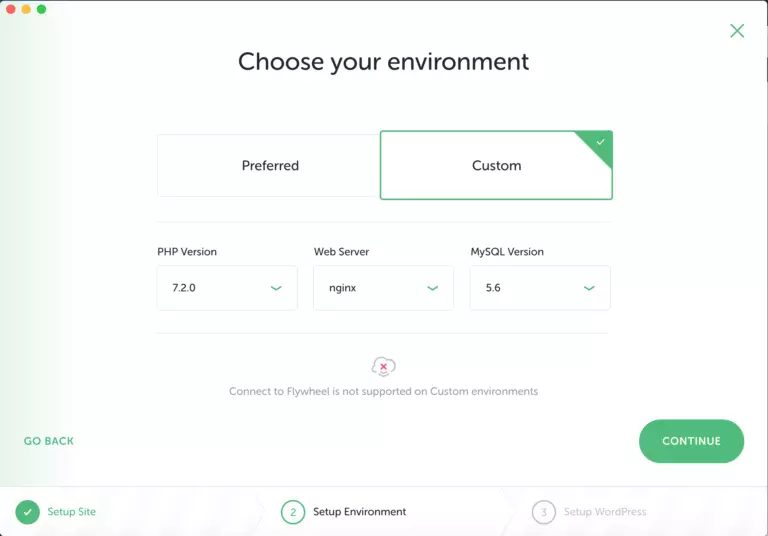 Make sure you select the “Custom” environment option.
You can still leave all options to their defaults
You don’t need a particular configuration, so you can leave all options to their defaults, or change them to your liking if you prefer.
If you want to enable Xdebug for an existing site using the “Preferred” environment configuration, you’ll have to convert it to a “Custom” environment first.
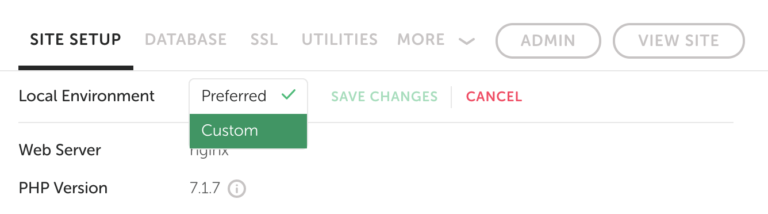
Under your site’s “Site Setup” menu item, you’ll find “Local Environment” where you can change from “Preferred” to “Custom”.
Enable Xdebug in Local by Flywheel – and configure PhpStorm
First, we have to enable Xdebug in Local by Flywheel and create the debug profile in PhpStorm. This is an extremely smooth process:
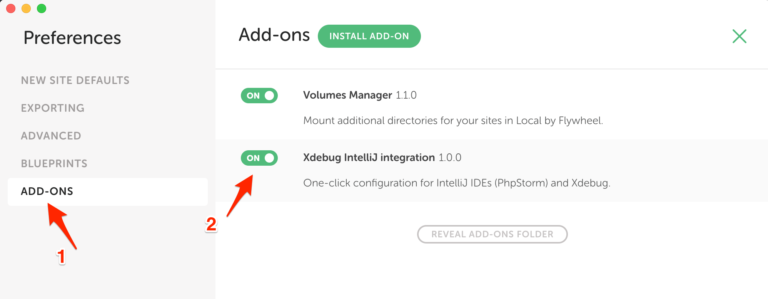 Enable the one-click configuration for IntelliJ IDEs (PhpStorm) and Xdebug
Navigate to the Local by Flywheel preferences. Under the “Add-ons” you’ll find the add-on “Xdebug IntelliJ integration” pre-installed. Enable it and close the preferences window.
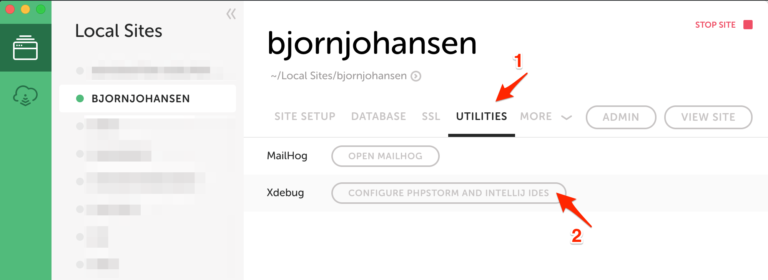 One-click-configuration of phpStorm for Xdebug in Local by Flywheel
Now, if you navigate to the “Utilitites” menu item on one of your site configurations, you should find a new button to configure PhpStorm (and IntelliJ IDEs) for Xdebug in Local by Flywheel.
If the button is disabled, go back and read the beginning of this article. You need to have a “Custom” environment to enable Xdebug.
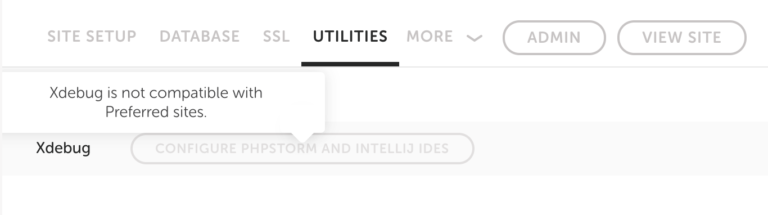 It is not possible to enable Xdebug when not using the “Custom” environment.
Click the button, and you should see a brief notification:
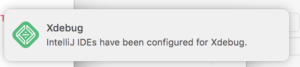
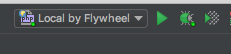
… and that’s pretty much all you have to do to get started with Xdebug in Local by Flywheel for PhpStorm. If you open PhpStorm, you should now find this new debug profile you can use to debug your sites with Xdebug:
Enable profiling in Xdebug
Enabling debugging using Xdebug in Local by Flywheel with PhpStorm is very easy, enabling profiling doesn’t take much more effort either, but the process is very different. Now you need to edit your site’s php.ini.
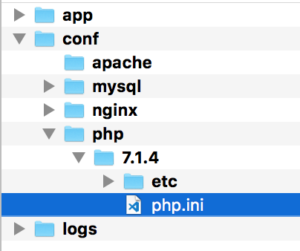 Each of your sites using the “Custom” environment configuration should have a file structure like this where you’ll find your php.ini
If you switch between multiple PHP versions for your site in Local by Flywheel, you need to edit the php.ini file for each version.
Close to the end of your php.ini file, you’ll find the Xdebug section that Local by Flywheel has added for you:
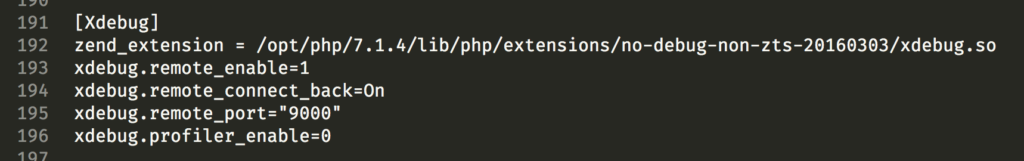 The default Xdebug section in php.ini
Here you can see that the Xdebug profiler isn’t enabled. But if you set xdebug.profiler_enable=1 you will enable the Xdebug profiler for every single request that you make on the site – which is probably not what you want. Instead you might want to add the following two lines:
xdebug.profiler_enable_trigger = 1
xdebug.profiler_output_dir = /app/profiler
The first line, profiler_enable_trigger, will make enable profiling only when a “trigger” is set. I like to use the extensions Xdebug helper for Google Chrome and Xdebug helper for Mozilla Firefox.
The second line, profiler_output_dir, is the path to the directory where the profiler snapshots will be stored. This is the path on the “server” – the container which your site runs in within Local by Flywheel. The absolute path /app/profiler will correspond to the same local path within your site files on your computer. It is probably a good idea to create that directory now, so it is ready for when you want to store profiling snapshots there.
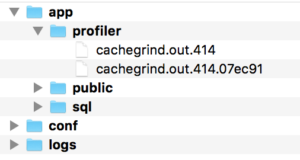 If you set your profiler output dir to /app/profiler,
this is where you’ll find the files on your computer
After editing the php.ini file, you’ll have to restart your site within Local by Flywheel for the changes to take effect.
The profiling snapshots are standard Xdebug profiling snapshots that can be viewed in any compatible viewer, like PhpStorm.
If you in PhpStorm navigate to Tools -> Analyze Xdebug Profiler Snapshot, you can analyze the Xdebug profiler snapshots from Local by Flywheel.
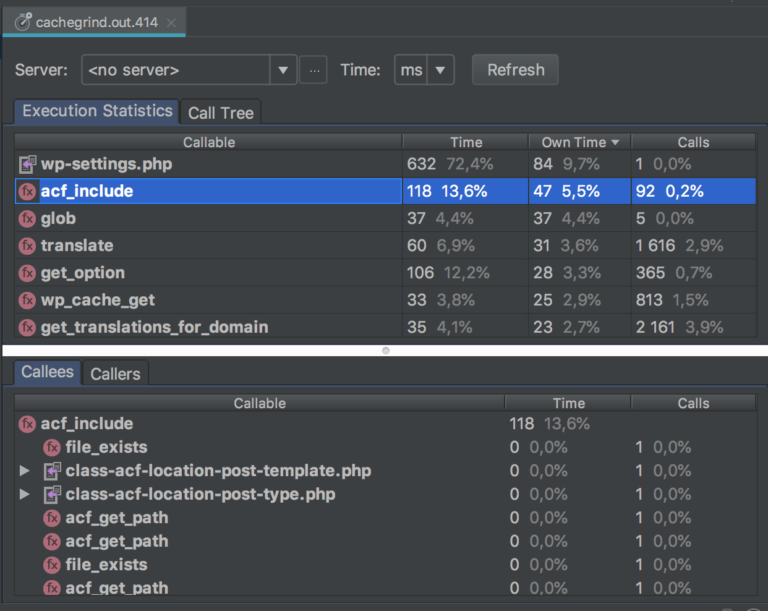 Analyzing an Xdebug profiler snapshot in PhpStorm
Have fun debugging and profiling your WordPress sites!